

Margo Kingston
Latest posts by Margo Kingston (see all)
- PODCAST: Jan Bowman chronicles Rudd to Chandler-Mather in Griffith - 26 March 2024
- PODCAST: Thousands of KTCs for #VoteYes – Mary Crooks on the Victorian Women’s Trust’s ‘Together, Yes’ campaign - 24 September 2023
- A ‘Deliberative Democracy’ conversation with Kylea Tink, #IndependentsDay MP for #NorthSydneyVotes - 5 September 2023
Here is the speech he delivered on the need for ambitious tax reform to the Tax Institute last month. In essence:
“The interests of the most disadvantaged are not being served by a tax system that is punishing innovation, denying people opportunity, undermining economic growth, and denying the sustainability of government service provision,” Dr Henry told a Tax Institute event in Melbourne. “Moreover, there can be no ignoring the extraordinary intergenerational inequity inherent in our present tax system.”
Ken is now a director of Accounting for Nature.
THE NEED FOR AMBITIOUS TAX REFORM – Ken Henry, 16 March 2023
IF YOU HAVE been following the media reporting on tax policy matters closely, you would probably be thinking that dealing with superannuation concessions for the wealthy is Australia’s big tax policy challenge. But only a few weeks ago, you might have been thinking that the big tax policy issue was whether the legislated stage three tax cuts should proceed. Not long before that, you might have been thinking that the biggest tax policy issue confronting not only Australia, but the entire world, has to do with the elusive incomes of multinational tech businesses.
Whilst all of these are important, even taken together, they don’t scratch the surface of the conversation we should be having about tax policy.
The Australian tax system is in a parlous state. It is not capable of raising sufficient revenue to fund the activities of government. Certainly not today. Far less at any time in the future.
Since funding the activities of government is the purpose of taxation, there can be no avoiding the conclusion that the Australian tax system is not fit for purpose.
For tax policy practitioners, the tax system design objective is usually articulated along these lines: that it be capable of generating sufficient revenue to underwrite fiscal sustainability, without unacceptable consequences for economic efficiency, fairness (including intergenerational equity), risk, and system complexity. Australia’s tax system fails every one of these tests.
Pre-COVID, Commonwealth government spending was growing at a faster rate than GDP (Figure One).

The only tax base in the federation that is budgeted to produce revenue growth at a faster rate than GDP is the personal income tax. And that is through the operation of fiscal drag. Right now, fiscal drag is the only instrument being deployed in the cause of Commonwealth budget repair. All tax bases other than personal income tax are fiscally unreliable. They are either highly volatile, debilitated by deliberate design concessions, or subject to tax competition and other sources of base erosion.
In 2019-20, 20 years after the introduction of the GST, the sum of the broad-based indirect taxes – sales taxes, customs and excise duties – collected by the Commonwealth amounted to 5.3 per cent of GDP. This was precisely the same level of indirect taxation as in 1997-98, when the Howard Government launched its landmark tax reform package A New Tax System. So, the ‘tax-mix switch’ at the core of A New Tax System, implemented 25 years after its being recommended in the Asprey Report, has been completely undone, in just two decades (Figure Two).

These trends in indirect tax collections will continue. The GST base is eroding, by design. Fuel excise is at particular risk because of the ‘electrification’ of the vehicle fleet. In our tax review, published more than 12 years ago, we recommended that it be abolished.
Australia’s company tax collections are unusually dependent upon the world prices of non-renewable natural resources. Abstracting from mining, company tax collections have been broadly flat as a share of GDP since the global financial crisis. But a country that suffers capital-shallowing and is a net capital exporter, as Australia is now, must eventually see company tax collections fall as a share of GDP.
At the state level, taxes on things like insurance look increasingly antiquated, especially on a continent so exposed to the increasingly alarming consequences of interdependent climate and nature crises. Property stamp duty and, for some states, resource royalties are highly volatile sources of revenue. Interstate competition for businesses and jobs is likely to lead to even further erosion of the payroll tax base.
We are back to where we were in the four decades between the end of WWII and the reformist period that commenced in the mid-1980s. Those four post-war decades were characterised by ill-disciplined public spending, with a heavy reliance upon fiscal drag that punished innovation, enterprise, and effort; distorted the pattern of saving; and rewarded tax avoidance and evasion.
Because it amounts to taxation by stealth, fiscal drag will naturally be the tax raiser of choice for any democratically elected government. But a tax policy strategy of reliance upon fiscal drag is much more dangerous, economically, socially, and politically, than at other times in our history.
Whilst government spending is growing strongly, the share of government spending being directed to the non-working, low tax paying, aged is also growing.
At the same time, and in stark contrast to the post-War period, because of population aging, a shrinking proportion of the population, made up of relatively young workers, will have to shoulder a rapidly accelerating share of the burden of financing government.
And this generation of young workers, weighed down with HECS debt, burdened with the responsibility of repaying a mountain of public debt and dealing with the costs of climate change, is finding it increasingly difficult to buy a home, having been priced out of the market by those who have already retired or are now moving into retirement, those who are sitting on tax-free capital gains in houses that are exempt from the pension assets test, those who are receiving refundable franking credits on share portfolios and a blend of publicly funded and tax-free private pensions from assets accumulated in lightly taxed self-managed superannuation funds.
At some point, perhaps even already, the intergenerational social compact must surely fracture.
So, what should we do?
Well, the first thing we should do is recognise that tax policy is not something to be designed in the abstract. Taxes exist only because of the need to fund the functions of government. Thus, tax policy must be seen as a core component of medium to long-term fiscal policy. In turn, fiscal policy is a core component of economic policy. And economic policy generally should be developed from an understanding of the economy we have now, why it is as it is, and an articulation of the sort of economy we want this to be, including for future generations of Australians.
This address is in three parts. First, I’m first going to talk about some significant features of the Australian economy that tend to get ignored in tax policy discussion. Second, I will talk about the state of the budget. And third, I will talk about the implications of those two things for thinking about the sensible design of the tax system.
Part 1: Economic performance
Like all other economies around the world, the Australian economy is being affected by three big global drivers:
- Climate change
- The digital revolution
- The Asian century
Two other drivers are home grown, even though they also affect several other countries:
- Population aging
- Widespread loss of biodiversity and ecosystem destruction.
Our economic performance has been affected profoundly by all five of these things. The way in which the first three – that is, the global drivers – have affected our performance has a lot to do with our pattern of national endowments, both natural and created. For example, the impact of climate change and the Asian century is particularly noticeable in Australia because of our traditional pattern of comparative advantage, based on an abundance of natural resources.
Mining is a highly significant feature of the Australian economy. Four charts serve to illustrate. Figure Three shows the share of total goods and services exports contributed by mining, manufacturing and other (including services). The chart commences in July 2005, when mining contributed between 25 and 30 per cent of total exports of goods and services. Manufacturing contributed about 40 per cent, and everything else (including services) contributed 30 to 35 per cent. Today, mining contributes about 60 per cent of total exports, with manufacturing and the ‘other’ category each contributing about 20 per cent.

Over the period shown in Figure Three, exports grew from about 20 per cent of gross domestic product to about 27 per cent. Thus, 30 per cent of exports in 2005 equated to about 6 per cent of GDP, whereas 60 per cent of exports at the end of 2022 equated to more than 16 per cent of GDP. Over that same period, manufacturing exports fell from about 8 per cent of GDP to about 5 ? per cent.
Figure Four shows the share of Australia’s total exports sold to China. This chart commences at the beginning of 1988, when China took about 3 per cent of our exports. Just prior to the imposition of COVID-period restrictions, it was taking more than 45 per cent.

Figure Five shows the share of corporate pre-tax profits generated by mining, manufacturing, financial services, and ‘other’.

Since mid-2005, mining has increased its share of total corporate profits from one-fifth to about a half. Manufacturing profits have fallen from about 20 per cent to less than 10 per cent, and the share of total corporate profits going to the financial services sector, including insurance, has fallen from 20 per cent to less than 5 per cent.
Figure Six shows the share of the Australian workforce employed by mining, manufacturing, and financial services. You might be surprised to observe that mining employs less than one a a half per cent of the Australian workforce. But that figure doesn’t include mining construction. In the boom times, mining construction activity draws workers from lower paying jobs all around the country, with a disruptive impact on labour markets and businesses just about everywhere.

In summary, mining employs a very small proportion of the Australian workforce, except in the boom times, when it induces a worker to leave other jobs for mine-site construction work, but generates about 60 per cent of Australia’s exports, about half of pre-tax corporate profits, mostly repatriated overseas to foreign shareholders, and exposes the Australian economy to highly volatile global commodity prices and a heavy strategic dependence upon a single buyer, China. Moreover, it is a sector heavily exposed to climate risk; specifically, the risk of global decarbonisation.
The state of the economy pre-COVID
For many years prior to the pandemic, the Australian economy had been performing poorly.
Figure Seven provides the five-year average rate of growth in real GDP per capita over four decades, commencing at the end of 1979, through to the end of 2019, immediately pre-COVID. The chart clearly shows that, before the onset of the pandemic, GDP per capita growth had been weak for many years. More than that, it had been in trend decline for two decades.
The recessions of the early 1980s and 1990s stand out clearly in the chart. By the middle of the first decade of the 21st century, GDP per capita growth appeared to have settled at around two to two and a quarter per cent a year. But then the global financial crisis hit. And growth hasn’t recovered. In the entire decade pre-COVID we recorded the sort of growth rates only previously recorded in recessions. COVID has made this record a lot worse, of course. And yet, in recent years, you would have had no end of politicians and commentators wanting to tell you how strongly the Australian economy has been performing.

The weakness in GDP per capita growth this century is largely explained by poor productivity performance. This is illustrated in Figure Eight. Productivity had been decelerating for a full decade by the time the global financial crisis hit. It started to recover post-GFC, before collapsing again from the end of 2015.

Our productivity growth rate is negatively correlated with the terms-of-trade, which are driven by international commodity prices, especially for coal, gas, and iron ore.
When global commodity prices strengthen, our productivity growth rate slows. This inverse correlation is shown in Figure Nine.
The chart ends pre-pandemic. In the past three years, the terms-of-trade have lifted even further to reach their highest level ever, and productivity growth has fallen below zero.

I have been talking about medium-term trends. There have also been shorter-term cyclical impacts on productivity performance. For example, some of the apparent lift in productivity growth following the global financial crisis can be explained by a ‘base affect’. Output per hour of work, which is how productivity is defined, was lifted to some extent because of a pronounced fall in average hours of work. This is illustrated in Figure Ten.

The average hours worked line in Figure Ten refers to average hours worked per capita. For any level of average hours worked per employee, an increase in the workforce participation rate or a fall in the unemployment rate lifts average hours per capita.
The decline in average hours worked per capita was especially pronounced during the global financial crisis. But it continued for about a decade following. If you put together the two lines in Figure Ten, you get the GDP per capita line shown in earlier charts. Thus, slowing GDP per capita growth over the course of this century so far has been a consequence of both weakening productivity growth and no trend improvement in average hours of work per capita.
Falling average hours of work don’t get much attention in Australian economic and political commentary. The common view today is that labour market outcomes are very strong. And it is true that, even pre-pandemic, we had a historically high workforce participation rate and a low unemployment rate. Yet, despite those things, average hours worked per capita, immediately pre-pandemic, were much the same as 20 years earlier. To put that another way, strengthening workforce participation and falling unemployment rates had been completely offset by falling average hours of work per employee.
Getting back to medium-term trends, why would a mining boom depress productivity growth?
The economic impact of an increase in global commodity prices and the terms-of-trade can be understood in several ways. One is to look at the behaviour of the real exchange rate.
Broadly, the real exchange rate adjusts the nominal exchange rates that you see quoted on the evening news by changes in our costs of production relative to those of our trading partners. In constructing real exchange rates, production costs are usually summarised in indices of nominal unit labour costs, derived from the ratios of nominal wages to labour productivity. Figure Eleven overlays the terms-of-trade with an index that I have constructed to calculate the real exchange rate, using the implicit price deflator for imports as a proxy for nominal unit labour costs in our trading partners. Figure Eleven illustrates the real appreciation and loss of international competitiveness of Australian industry caused by the mining boom.

An appreciation of the real exchange rate is a natural macroeconomic adjustment to a positive terms-of-trade shock in an economy that is close to full employment, and in which the fiscal authorities just ‘let it rip’, not releasing the pressure with a resources super profits tax or something similar. Effectively, the real appreciation squeezes other sectors to make room for the sector that is booming (1). To put that in other language, it creates a ‘two-speed economy’. Some of you will remember that language from 15 years ago. You don’t hear the expression today, even though we still have a two-speed economy.
While not shown in Figure Eleven, the resources boom caused an appreciation of the nominal exchange rate of the order of 25 per cent. By 2011, the increase in domestic nominal unit labour costs relative to trading partners, coming through both wage inflation and weak productivity growth, had added a further 35 per cent to the appreciation of the real exchange rate.
Thus, between the end of 2003 and the June Quarter 2011 the real exchange rate increased by more than 60 per cent. Figure Eleven shows that whilst some of the loss of international competitiveness suffered by trade exposed Australian industry due to the resources boom has been reclaimed since 2011, a substantial amount persists. Immediately pre-pandemic, the real exchange rate was still 45 to 50 per cent above its level 20 years earlier.
Much of Australia’s productivity growth, historically, has been a consequence of capital-deepening, driven by a strong rate of business investment. Figure Twelve overlays the terms-of-trade with non-mining investment as a share of GDP, over the two decades pre-COVID.

The collapse in the non-mining investment rate – that is, the ratio of non-mining investment to GDP – appears coincident with the GFC. But this is misleading. As shown on the previous chart, the collapse followed a decade during which non-mining producers suffered a profound loss of international competitiveness.
The collapse in the non-mining investment rate is remarkable. It might not look like a lot, falling from 7 per cent of GDP to 5 per cent, but it is. Business investment has been so weak, for so long now, that two centuries of capital-deepening have stalled. Eventually, that drop in the investment rate of two percentage points of GDP translates into a drop in productivity, GDP, and GDP per capita of the order of 20 per cent (2).
The financial mirror image of declining physical investment and capital-shallowing is that, in recent years, we have recorded net capital exports on the balance of payments. Many commentators appear to believe that we have become a net capital exporter merely because superannuation has boosted household saving. But I would argue that we are exporting capital because Australia has become an increasingly unattractive destination for doing business, in the eyes of foreign investors and Australian savers alike.
Let me put it this way. The saving and investment balances of all countries have been affected by the Asian century. But it is truly extraordinary that this country, which stood to gain the most, should be suffering capital-shallowing, and should be a net capital exporter, notwithstanding a historic mining boom.
Yet, that may be a natural consequence of fiscal policy that has simply ‘let it rip’, undermining Australia’s international competitiveness.
To compensate for the loss of competitiveness, wages paid by trade-exposed Australian businesses would have to fall by about a third, or labour productivity would have to increase by about 50 per cent. These are huge adjustments. Neither is going to happen quickly, if at all.
Understanding the size of the adjustments that would be needed to restore international competitiveness provides a plausible explanation for a decade of more of sluggish nominal wages growth. To put it in a nutshell, the mining boom has left us with a very big competitiveness overhang that will probably take decades to work off.
What does this imply for tax policy design?
Well, firstly, as I will argue in a moment, the case for tax reform today rests strongly on the need to raise substantial additional revenue to fund the activities of government. That would be much easier to do in an economy experiencing strong productivity and wages growth.
And secondly, much of the loss of international competitiveness caused by the mining boom could have been avoided had we had the intellectual and political capacity to apply a rational taxation regime to the windfall profits of mining companies. We didn’t have to ‘let it rip’. We didn’t fall into this hole by accident. We chose to be here.
To be fair to the Rudd Government, they did try, with the so-called Resources Super Profits Tax announced in 2010. Their failure illustrates a lesson to which I will return in the third part of this address: Leaders can’t do anything without a compelling narrative. The dominant narrative at the time, both here and overseas, was that the mining boom was a ‘good luck’ story for Australia, underpinning the myth that Australian prosperity was being driven by the mining sector. Absent a compelling narrative to the contrary, the Rudd Government stood accused of wanting to kill the goose that was laying the golden egg.
And there is another lesson to be drawn. Good policy is rarely essential. It is merely good. All policy ‘cans’ may be kicked down the road, often for decades. And ‘second best’ or ‘third best’ policy, tinkering around the edges, is generally sufficient to satisfy those who take an interest. But a failure to embrace first best policy always has a cost. Because of several such failures, these costs have been building in Australia for two decades. And today, they impose a heavy burden on our economic performance.
Our poor record economic performance of the past 20 years underscores the need for large scale structural reform of the Australian economy.
Part 2: Fiscal sustainability
Economic growth was so weak during the decade immediately pre-COVID that the Commonwealth budget had not even begun to be repaired from the damage inflicted by the global financial crisis of 2008-09. Ten years into the post-GFC growth cycle, the budget should have been in a strong surplus position, repaying public debt. But it hadn’t even got back to balance.
All Commonwealth budgets delivered in that period affirmed a commitment to the medium-term fiscal strategy, first introduced by the Howard Government in the late 1990s, of balance on average over the cycle. Some years before the pandemic, that commitment had surely lost credibility. When the pandemic struck, it was simply jettisoned.
Today, we don’t have a medium-term fiscal strategy, even though the Charter of Budget Honesty Act (1998) requires that ‘the Government’s fiscal policy is to be… set in a sustainable medium-term framework’ and that ‘fiscal strategy statement(s)’, which are required to be publicly released and tabled in Parliament with each budget, must ‘specify the Government’s long-term fiscal objectives within which shorter-term fiscal policy will be framed’.
Like several budgets that preceded it, the budget presented by Treasurer Chalmers in October last year does not contain a credible medium-term fiscal strategy. Hopefully, that will be rectified in the budget to be released in May.
Whilst the October Budget did not articulate a credible medium-term fiscal strategy, it did contain a fiscal strategy statement. In respect of the revenue side of the budget, it said this: ‘Delivering a tax system that funds government services in an efficient, fair and sustainable way.’ That’s what most of the rest of this address is about, so I’ll come back to that statement. But I need to do some more framing first.
Size of government
In 2002, pursuant to the Charter of Budget Honesty, the Howard Government released the first Intergenerational Report (IGR1).
Consider Table One. IGR1 projected that, with no fundamental policy change, Commonwealth spending would amount to 21.4 per cent of GDP in 2005-06, then grow by 2 percentage points of GDP by 2021-22, 4 percentage points by 2032-33 and 6 percentage points by 2041-42.
How good were those projections? Well, in fact, Commonwealth spending was already 24.1 per cent of GDP by 2005-06, 2.7 per cent of GDP higher than had been projected in IGR1, published just a few years earlier.
All Australian governments since Whitlam have wanted to boast their ‘low taxing’ credentials. But spending must be paid for. By 2006-07, the last full fiscal year of the Howard Government, the seven-year average tax-to-GDP ratio was 23.9 per cent.
No other Australian government, before or since, has recorded higher tax collections as a share of GDP. Ironically, once the Howard Government had left office, its record-breaking tax burden, of 23.9 per cent of GDP, then became a political ‘cap’ on tax collections, endorsed by successive governments, from both sides of politics, until this one.
Starting 2.7 percentage points of GDP higher in 2005-06, Table One shows that by 2021-22, spending had increased by another 2.7 per cent of GDP. And in the most recent Budget, published in October last year, it is now projected to grow by more than a further percentage point by 2032-33, the last year of the medium-term projections.
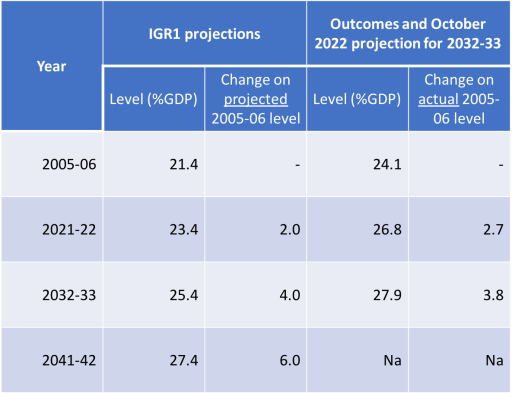
So, IGR1 got the 2005-06 base wrong, but its projected 4 percentage point increase in spending as a share of GDP between 2005-06 and 2032-33 remains consistent with the most recent projections.
The fiscal importance of economic growth
Because we are considering levels of spending as a proportion of nominal GDP, the behaviour of the denominator is quite important. For any given level of projected future spending, a faster rate of growth in nominal GDP means a smaller spending-to-GDP ratio.
Nominal GDP has two components, quantity and price. The quantity component is real GDP, which is what people reference when talking about the economy’s rate of growth, or what is happening to GDP per capita (that’s simply real GDP divided by the population). The price component is captured in what economic statisticians label the GDP implicit price deflator (IPD), or simply the GDP deflator. This provides a broad measure of inflation across all components of economic activity, not just consumption.
So, the projections shown in Table One are a consequence of projections of spending growth, but also projections of growth in both real GDP and the GDP deflator. Following release of IGR1, Treasurer Peter Costello made the point on many occasions that if you wanted to stop the spending to GDP ratio from increasing as per the projections, you had to work on restraining spending growth, lifting the growth rate of nominal GDP, or both.
In respect of the GDP deflator, we simply assumed growth from 2005-06 of 2 ? per cent a year, in line with the mid-point of the RBA’s target band for consumer price inflation. Nobody thought that controversial at the time. But our projections of growth in real GDP and real GDP per capita were controversial.
Growth accountants like to break-down real GDP growth into various components. Two principal components are employment growth and labour productivity growth. Since labour productivity is defined as real GDP per hour of work, the employment growth measure should be growth in hours worked, not growth in employees. This is an important distinction, as I noted earlier.
Table Two reproduces the IGR1 projections for average annual growth in labour productivity, employment, real GDP and real GDP per capita.

The labour productivity growth projections from 2005-06 were based on nothing more sophisticated than an average of the actual rates recorded in the 1970s, 1980s and 1990s. The employment projections were influenced heavily by demographic projections and modelling. The principal driver here is that growth in hours worked can be expected to slow as the population ages.
We now have outcomes data for the first two decades of the 21st century.
When the first Intergenerational Report was published, it was met with widespread scepticism, even cynicism. That could be because, with Treasurer Peter Costello leading the argument publicly, we were developing a narrative about the need for both spending restraint and economic reforms that would lift the rates of growth in productivity, employment, GDP and GDP per capita. The projections, and the narrative, appeared self-serving, which they were designed to be, of course.
One of the better pieces of commentary at the time described the projections as a ‘self-defeating prophesy’: they were so alarming that no government would allow them to be realised.
And then, within a couple of years of the publication of IGR1, the Australian economy began to feel the effects of a completely unanticipated surge in offshore demand for energy and mineral resources, due principally to an extraordinary acceleration in Chinese growth. Nearly everybody considered that the positive impact of the mining boom had blown the IGR projections out of the water. Nominal GDP growth was very strong. So, everything was going to be alright.
But, as shown earlier, they were wrong.
According to the narrative we developed back in 2002-03, if we were to have a chance of avoiding an increase in spending relative to GDP, we would have to lift the average rate of growth in GDP per capita over the first 20 years of the 21st century, from a projected one and three quarter per cent a year to two and a quarter per cent. But as Figure Seven shows, we didn’t even achieve the low figure of one and three quarter per cent, merely one and a quarter per cent. And remember, this is pre-COVID. Remember, too, that unlike the rest of the developed world, we avoided recession in the global financial crisis.
Today’s GDP per person is only 80 per cent of what it would have been had our policy makers risen to the challenge posed by IGR1. To put that another way, had policy makers met the growth challenge articulated in 2002, then notwithstanding the sizeable increase in the size of government shown in Table One, the budget would not be in deficit today.
When we were putting together the tax review in 2008 and 2009, we avoided taking a position on the size of government. We simply noted that one of the considerations that should guide tax design is that, should there be a need to raise additional revenue to finance a higher level of spending, that can be done with minimal economic cost and without damaging implications for equity, including intergenerational equity.
Today, it would simply be foolish to pretend that we do not have to finance a significantly higher level of government, with that burden increasing over time.
For people who understand the fiscal challenge confronting Australia, the extraordinary amount of noise being made about a superannuation tax adjustment designed to raise about $2 billion of additional revenue sounds shrill. Right now, Commonwealth tax revenue should be at least 2 per cent of GDP higher. That’s about $50 billion a year in today’s money. And, given the pressures of accelerating spending on defence, health care, aged care, and disability support, among others, we are clearly going to have to raise the tax-to-GDP ratio even higher over the decades ahead.
The state of the budget demands large scale structural reform, on both the spending and revenue sides.
Part 3: Tax reform
In the second half of the 1990s, economists around the world started to get excited by an unexpected acceleration in productivity in the United States. Eventually, the word got out that Australia was experiencing an even more rapid surge in productivity. So much so that over the 1990s, we closed much of the GDP per capita gap to the United States. And by the end of that decade, as the United States and much of the rest of the northern hemisphere fell into a ‘tech wreck’ recession, economists from that part of the world were describing Australia as the ‘miracle economy’.
There was nothing miraculous about our economic performance. It was a consequence of an obsession with first best policy design and a generation of well-motivated politicians capable of leading a reformist transformation.
We need to get back to that place.
The bases for GST, company tax, personal income tax, FBT and payroll tax are related to GDP. But GDP is also affected by tax design. As we have seen, poorly designed taxes retard growth in GDP and weak GDP growth undermines tax collections, weakening the budget.
This was the central message of IGR1.
And it is my key message today. Efforts to reform the Australian tax system must be directed both to fiscal sustainability, and to turning around a chronic, 20-year, deceleration in GDP per capita growth. Everything else is second order.
What would a good tax policy strategy look like?
The need to drive faster growth in GDP per capita implies a focus on three high level tax reform strategies: First, lift productivity. Second, encourage greater workforce participation, by which I mean more hours worked per capita. And third, enhance economic resilience.
Our tax review, Australia’s Future Tax System, published in 2010, observed that, whilst there are more than 100 different taxes in the Australian federation, these apply to only a handful of tax bases: consumption, labour income, capital income, economic rents, land and other natural resources.

The Commonwealth tax system places a heavy reliance upon a narrow slice of capital income (especially company income, but also interest income received by individuals) and labour income (personal income from employment and enterprise) and the states place a heavy reliance upon labour income (payroll tax) and transactions taxes (property stamp duties and stamp duties on motor vehicles). The tax review made it clear that, over time, the Australian tax system should place less reliance upon these bases and rely more heavily upon consumption, economic rents, land, other natural resources, and environmental externalities, including carbon emissions.
Productivity
Policy reforms to boost productivity growth should focus on allocative efficiency, other contributors to multifactor productivity and, most importantly, capital-deepening.
Our tax review identified several reforms that could be expected to enhance allocative efficiency, including the following:
First, replacing fuel excise, motor vehicle stamp duty, registration fees and all other charges associated with motor vehicle ownership with comprehensive road user charges that take account of road surface damage, noise and congestion externalities, and most importantly, carbon emissions embedded in whatever source of energy drives the car.
Second, broadening the base of the GST, reforming payroll tax to remove various exemptions and removing taxes on insurance and other nuisance taxes. We observed that an obvious option would be to replace all three with a uniform, broad-based business cashflow tax.
Third, applying a discounted, uniform rate of tax to the various returns to individual saving: interest, rent, dividends and capital gains. This would also help address housing affordability concerns.
And fourth, legislating an economy-wide, technology-neutral set of arrangements that achieves a reasonably certain, low volatility set of forward prices on carbon.
The failure to implement this reform program has cost us dearly.
Other policy reforms that could be expected to boost multifactor productivity growth include the targeted use of cashflow taxation, in place of normal income tax, to encourage the commercialisation of new and emergent technologies.
Policy reforms to support capital-deepening need to target the rate of business investment. These include policy reforms that reduce the cost of doing business in Australia relative to other countries; and reducing the level of tax embedded in the cost of capital. The last of these could be achieved through a lower company tax rate, especially for large companies; but, as we noted in our review, there are other options worth exploring, including a pure cash flow tax or a so-called allowance for corporate equity (ACE). The guiding principle should be to reduce the rate of tax applying to the normal return on capital while increasing the rate of tax applying to economic rents, including rents derived from the exploitation of our non-renewable resources, like coal and gas.
Participation
Workforce participation would be enhanced by tax reforms that reduce reliance upon personal income tax, and especially fiscal drag. The equity of the personal income system would be enhanced by taxing fringe benefits at marginal rates, reforming the taxation of superannuation and exempting scholarships from tax. The removal of property stamp duties, replaced by annual land taxes, would also enhance labour force participation by removing a significant impediment to geographic mobility.
Resilience
Large companies engaged in mining, banking and retail are affected by the international competitiveness of Australia’s company tax system, but probably less so than mid-tier businesses. Australia lacks economic diversity in part because of its inability to attract, retain and develop a sufficient supply of mid-tier businesses in a wide range of industries. Tax reforms that boost productivity and participation would enhance Australia’s attractiveness as a destination for such businesses.
Those thinking about framing a new tax reform package at this time will be asking themselves a few questions worth a moment’s reflection here today.
1. Is tax reform fair?
I don’t recall any sensible tax reform, ever, that was not labelled unfair. Several of the necessary reforms to the Australian tax system would be considered by some to be regressive. But the interests of the most disadvantaged are not being served by a tax system that is punishing innovation, denying people opportunity, undermining economic growth, and denying the sustainability of government service provision.
Moreover, there can be no ignoring the extraordinary intergenerational inequity inherent in our present tax system.
And there is a broader policy point to be made here. The fairness of the system cannot, and should not, be assessed by examining the fairness of each of its components in isolation. And the system I am referencing here is the entire tax and transfer system. This is one reason why incrementalism in tax reform usually fails, a point to which I will return in just a moment.
2. Should tax reform be accompanied by changes to federal roles and responsibilities?
Given the fragility of the tax systems at both levels of government, it is worth asking whether it is sensible to pursue a national growth strategy and budget improvement without also addressing roles and responsibilities between the Commonwealth and the states.
Taking a national perspective, we need to place less reliance on the tax bases from which the Commonwealth derives most of its revenue (income tax on workers, innovators, and companies) and more reliance upon the tax bases from which the states have traditionally derived most of their revenue (consumption, land, and other natural resources) and user charges (especially road user charges). Reforms in this direction mean a larger share of the national tax collection going to the states. Over time, this would help to address the so-called ‘vertical fiscal imbalance’ that has characterised the Australian federation.
The development of a national tax reform package also exposes the opportunity to consider a reallocation of responsibilities between the Commonwealth and the states, especially in areas of duplication, like economic and environmental regulation, health, aged care, education, and emergency services.
Moreover, the need to deal with the highly destructive, politically motivated, blame shifting that is a feature of all these areas has been exposed by a sequence of recent disasters, including the pandemic, drought, bushfires of unprecedented intensity, and floods equally unprecedented. The climate crisis implies that these sorts of stresses will only get worse, with climate adaptation challenges increasingly serious. We must fix this mess.
3. The scope of reform
In recent weeks there has been something of a debate about ‘incrementalism’ versus ‘big bang’ reform approaches. I have been a little surprised to read some of our better commentators arguing the merits of the former over the latter, suggesting that we have had great success with incrementalism, that ‘big bang’ approaches always fail.
Respectfully, I have a different view.
In the past 40 years, there have been only two ‘big bang’ tax reform processes in Australia. I would rate both as successes.
The first ‘big bang’ emerged out of the June 1985 Tax Summit. It rolled across the income tax landscape for all the second half of the 1980s, delivering Fringe Benefits Tax, substantiation of work-related expenses, capital gains tax, denial of entertainment as a tax deduction, taxation of superannuation, taxation of foreign source income and a great deal more.
The second ‘big bang’ was the Howard Government’s tax reform package developed in 1997 and 1998 that delivered the GST, abolished the Wholesales Tax, Bank Accounts Debit Tax, and numerous state level stamp duties, completely overhauled the family payments system, and a great deal more.
There has been no ‘big bang’ tax reform effort since.
If you think that the Rudd Government’s response to our tax review in 2010 constituted a ‘big bang’ approach, then you probably weren’t around at the time. In announcing the resources super profits tax, Prime Minister Rudd and Treasurer Swan were roundly criticised by our newspaper editors and leading commentators for doing only the easy, populist stuff, for avoiding a broad scale ‘root and branch’ tax reform that would respond to the challenges identified in our review. Set against the enormity of those challenges, and the reform map laid out in our review, I too considered the tax changes announced by the government in 2010 to be incremental.
The fact that the resources super profits tax might look like a ‘big bang’ exercise today is probably due to two things. First, in the period since, every tax proposal floated by our political leaders, in both government and opposition, has been even less than incremental, mere tinkering. And second, if you give a lot of well-armed people only one target to shoot, it will take a pounding.
Incrementalism sets up a single target on a battlefield occupied by well-resourced attack forces.
More importantly, incrementalism cannot address our budget and broader economic challenges. No amount of incrementalism is going to meet our fiscal challenges, far less turn around two decades of declining average living standards.
There is no point planting a seed in a desert when what is needed is continental scale reforestation.
4. What would a sensible tax reform look like?
We don’t need another tax review. It is true that things have moved on since our review was published 12 years ago, but only in directions that strengthen the case for the recommendations we made then.
What we do need is a process. And, specifically, we need an inclusive, cooperative Commonwealth-State process. This should not be beyond reach right now.
The process should start with an exploration of trends, and risks, in spending pressures at all levels of government. It should consider, collectively, which of these can be trimmed and, in all areas, which level of government should have responsibility for policy design and program delivery.
It should then consider the tax bases that are likely to be the more robust, given the drivers, both global and domestic, to which I referred at the start of this address, including the Asian century, climate change, the digital revolution, population aging and the need to set the nation on a course to nature positive.
The process should identify the tax bases upon which increasing reliance can be placed and those that should be avoided to boost growth prospects, and with acceptable implications for distributional equity. That means examining the tax, transfer, and retirement income systems in concert.
And then it should determine the allocation of taxing powers. Of course, there are constitutional issues to be acknowledged here, but that’s no excuse for avoiding this project.
Of course, this is a lot of work. But it doesn’t all have to be done in six months. And we know it can be done, because we have taken on much bigger projects in the past. The 2008-09 tax review, the parallel review of federal financial relations, and the multiple Commonwealth-State reform processes led by senior ministers in the Rudd Government, covering all key policy areas, was much more challenging. And that work was being undertaken at the same time as we were dealing with the global financial crisis.
5. Leadership
We have grown used to seeing senior politicians avoiding responsibility for addressing any problem other than the most immediate. And to be fair, they have had a lot to deal with, especially given the adversarial tenor of political discourse and fractious media commentary.
To any political leader, tackling tax reform is going to present like a mountain range covered in ice.
And today’s tax reformers do not enjoy the political luxury available to the Howard Government, to craft a revenue-negative reform package, nor even a politically challenging revenue-neutral package, such as that constructed by Treasurer Keating in the mid 1980s. The package needed on this occasion must be revenue positive.
So, this is going to be hard.
But then, tax reform has never been a safe place for a political leader. Treasurer Keating used to describe it as a high wire act without a safety net.
Yet, tax reform can present as an attractive place for a politician who wants to demonstrate his or her leadership qualities. It can be an attractive place for a leader to demonstrate a deep understanding of where we are, and why. For a leader wanting to articulate an inspiring vision of the opportunities that lie beyond the ice-covered mountain range and an appreciation of what it will take to get us to that place. And most importantly, for a leader with the ability to weave these elements into a compelling narrative that has the nation signing up for the journey.
It is that sort of leadership that tax reform needs today.
(1) Monetary policy tightening can ensure that more of the real appreciation comes through the nominal exchange rate and less through nominal unit labour costs.
(2) This is a steady-state result. Suppose production can be represented by a Cobb-Douglas function with a capital share of 40 per cent, and that the rate of labour force and population growth is two per cent per annum.
Feature Image: Joe lope, CC BY-SA 4.0 https://creativecommons.org/licenses/by-sa/4.0, via Wikimedia Commons


